Reports
Megh Portal provides two types of reports for the user reference i.e. Site report and rule report.
Site Reports
This functionality provides all site wise data grouped by analytics listed in the form of reports. The date and time in the report section will be shown according to the site timezone.
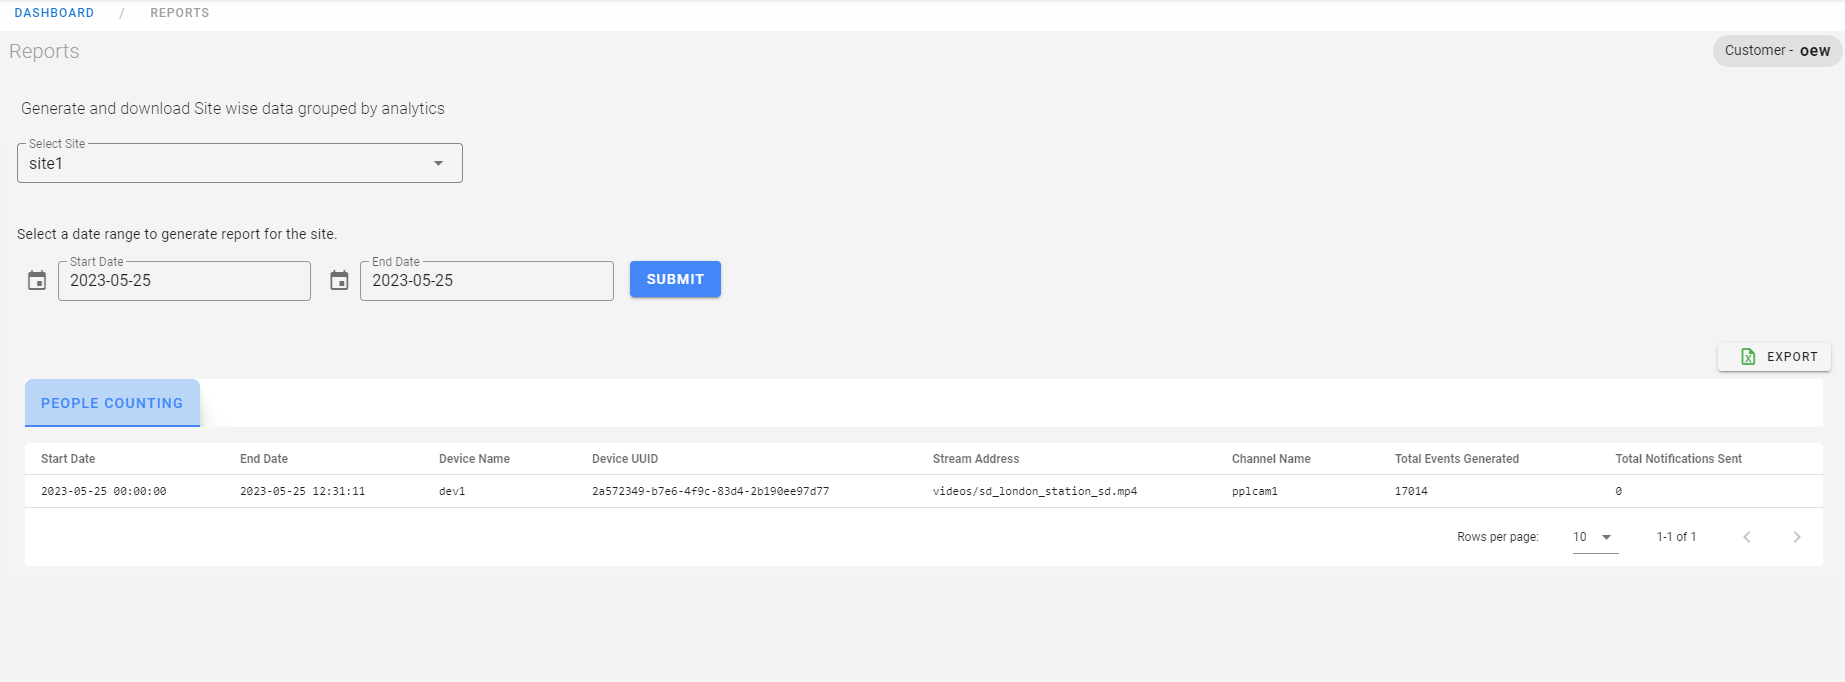
The user can generate the report by selecting the site, start and end date and click on submit.
This puts up a report on the page with the usecase as the header, containing the dates, device name, device UUID, stream address, channel name, total alerts generated, total notifications sent.
The user can also export the details to an Excel sheet by clicking on the export option and download the reports to their systems.
Rule Reports
This functionality provides all rule wise data grouped by site listed in the form of reports. The date and time in the report section will be shown according to the site timezone.
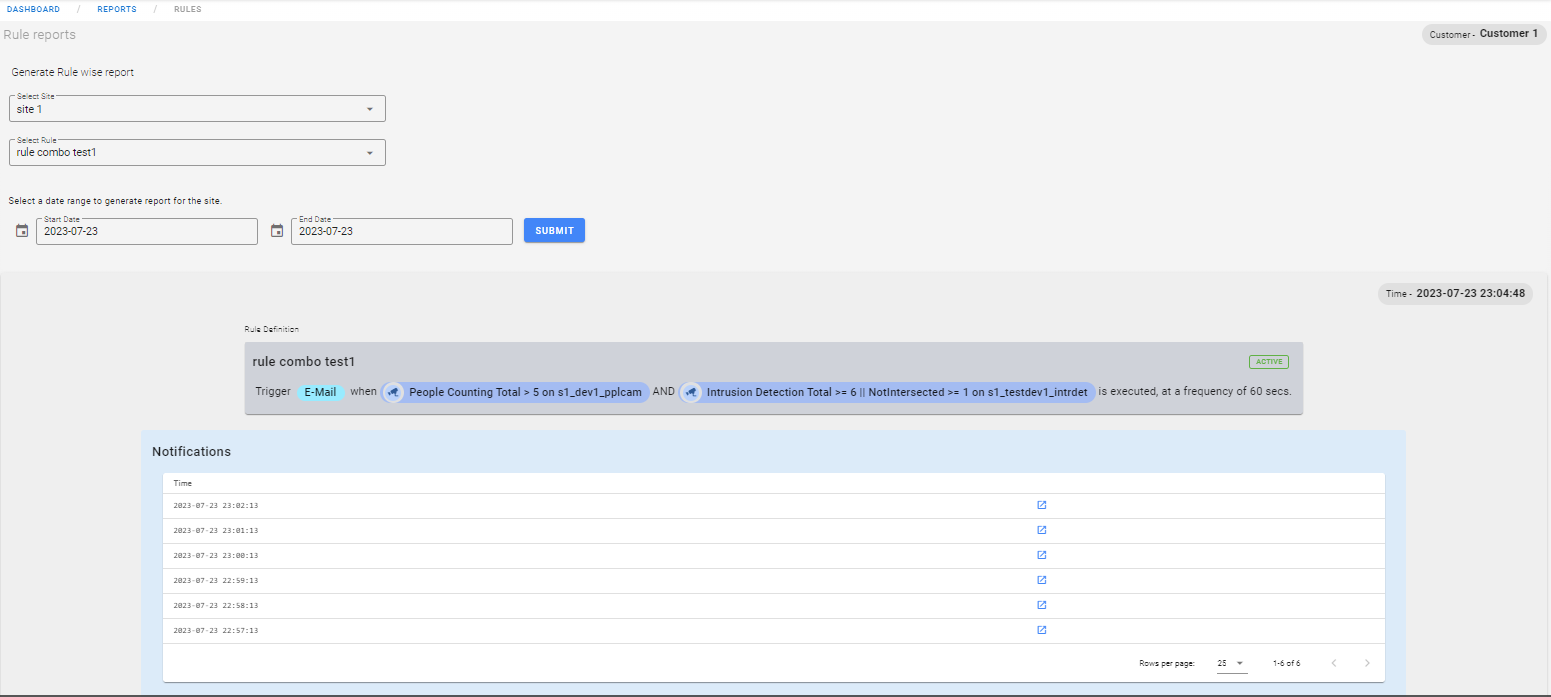
As shown in the above image, user has to select the site and the rule and select date range for which they want to generate report for the selected rule. This lists the rule report containing rule card and notifications generated for that rule, notification history real time graph and event history real time graph as shown in the below image.
The rule card shown in the above image displays all the details of the rule i.e., rule name, rule active/in-active, notification type set for the selected alert condition.
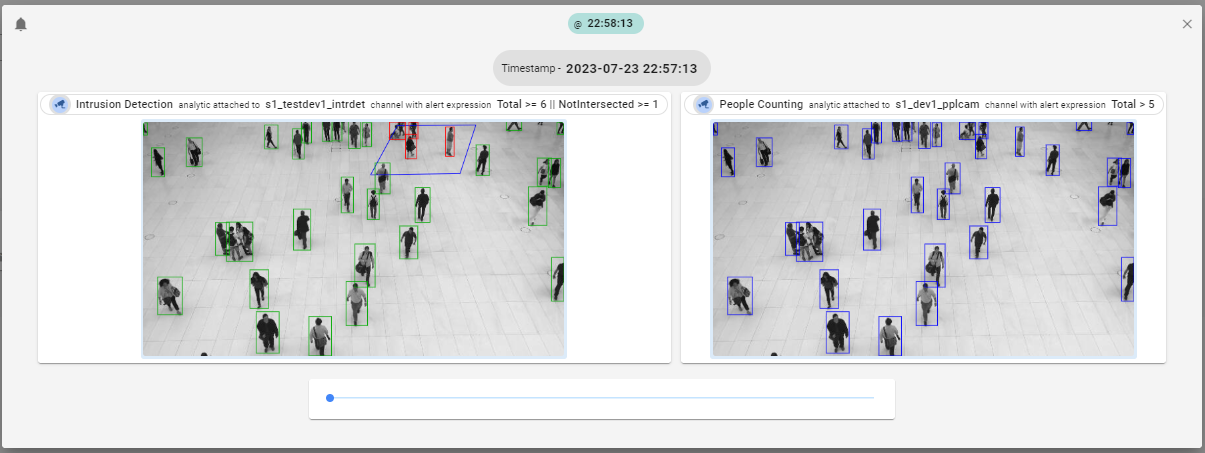
Next there is a notification table which lists all the notification generated for the selected rule. User can click on blue link to visualise notification frames at particular time. The below image show notification frames for rule which is created combining two alerts from different devices. When there is two different video feed then the notification frames are visualised in two different channel window as shown below.
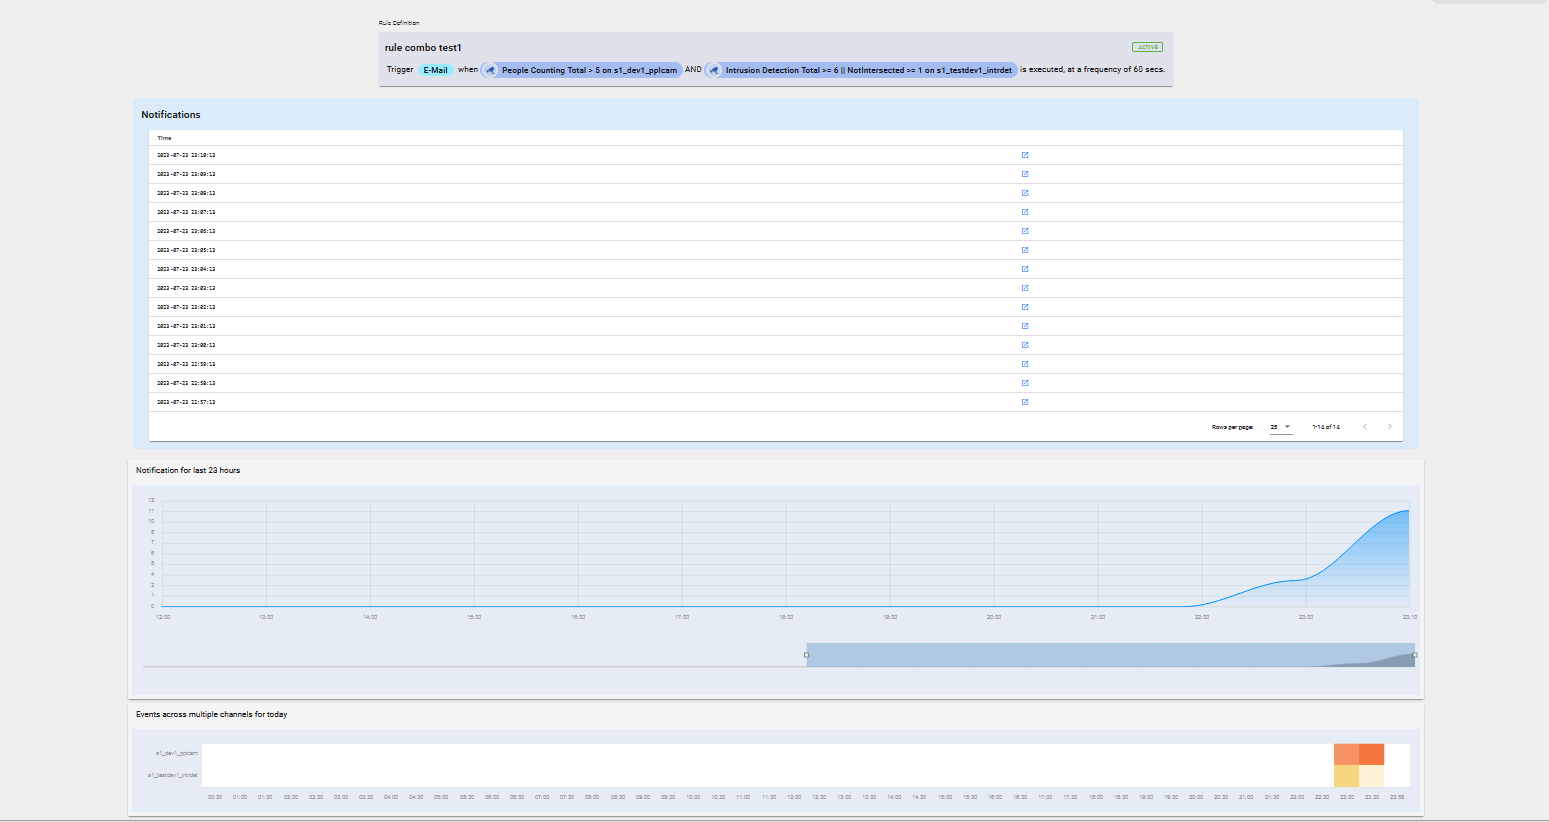
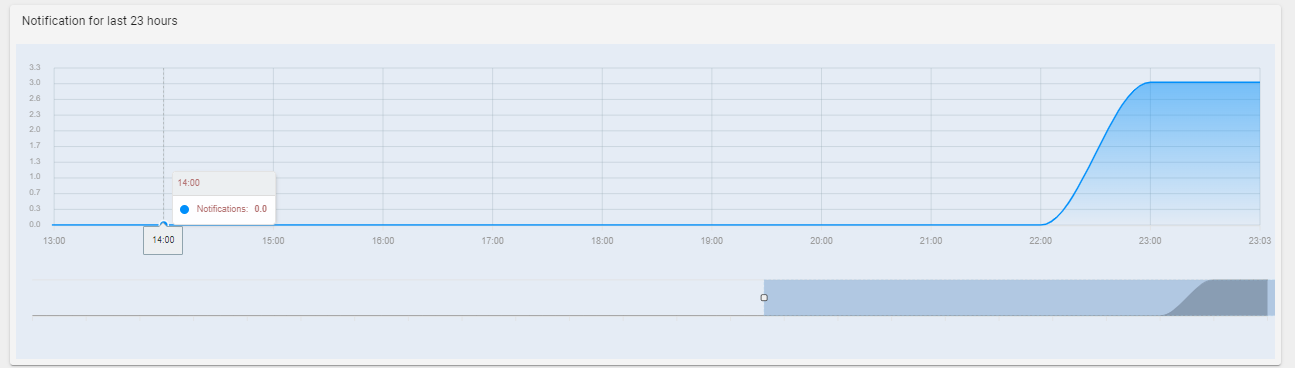
Next, rule report contains Notification history timeline graph as shown in below image. This graph displays the time on the x-axis and number of notifications on y-axis. Based on the number of rule notifications received at particular time the graph is displayed using line graph. The user can use the below blue high-lighter to move to particular point in the graph and display that on the graph.
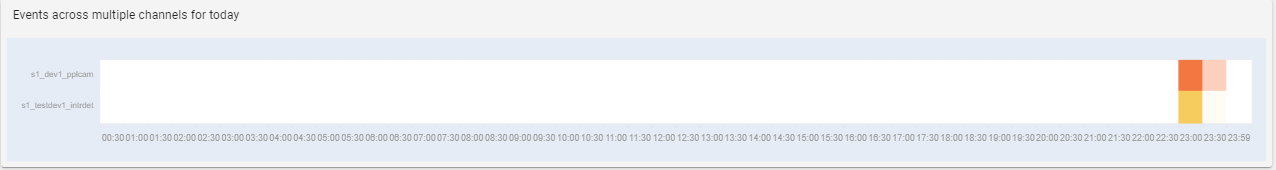
Rule reports also contains Event history real time graph. This displays the total number of events occurred at particular time in the form of heat map. Showing different intensity colors i.e. at time 20:00 it is showed in brown color(high intensity) compared to one at 20:30 which is in light yellow color(low intensity) as number of events at time 20:00 is more compared to events occurred at 20:30.