Event History
The Event details can be viewed in the Event History tab .
Each Event is put up according to the time with details of that use case. For example, for Physical distancing usecase, details like Threshold, Non violation, Violation and Total Detection are specified and similarly for loiter detection usecase, details like threshold, dwell time in seconds, dwell time violations as shown in below image.
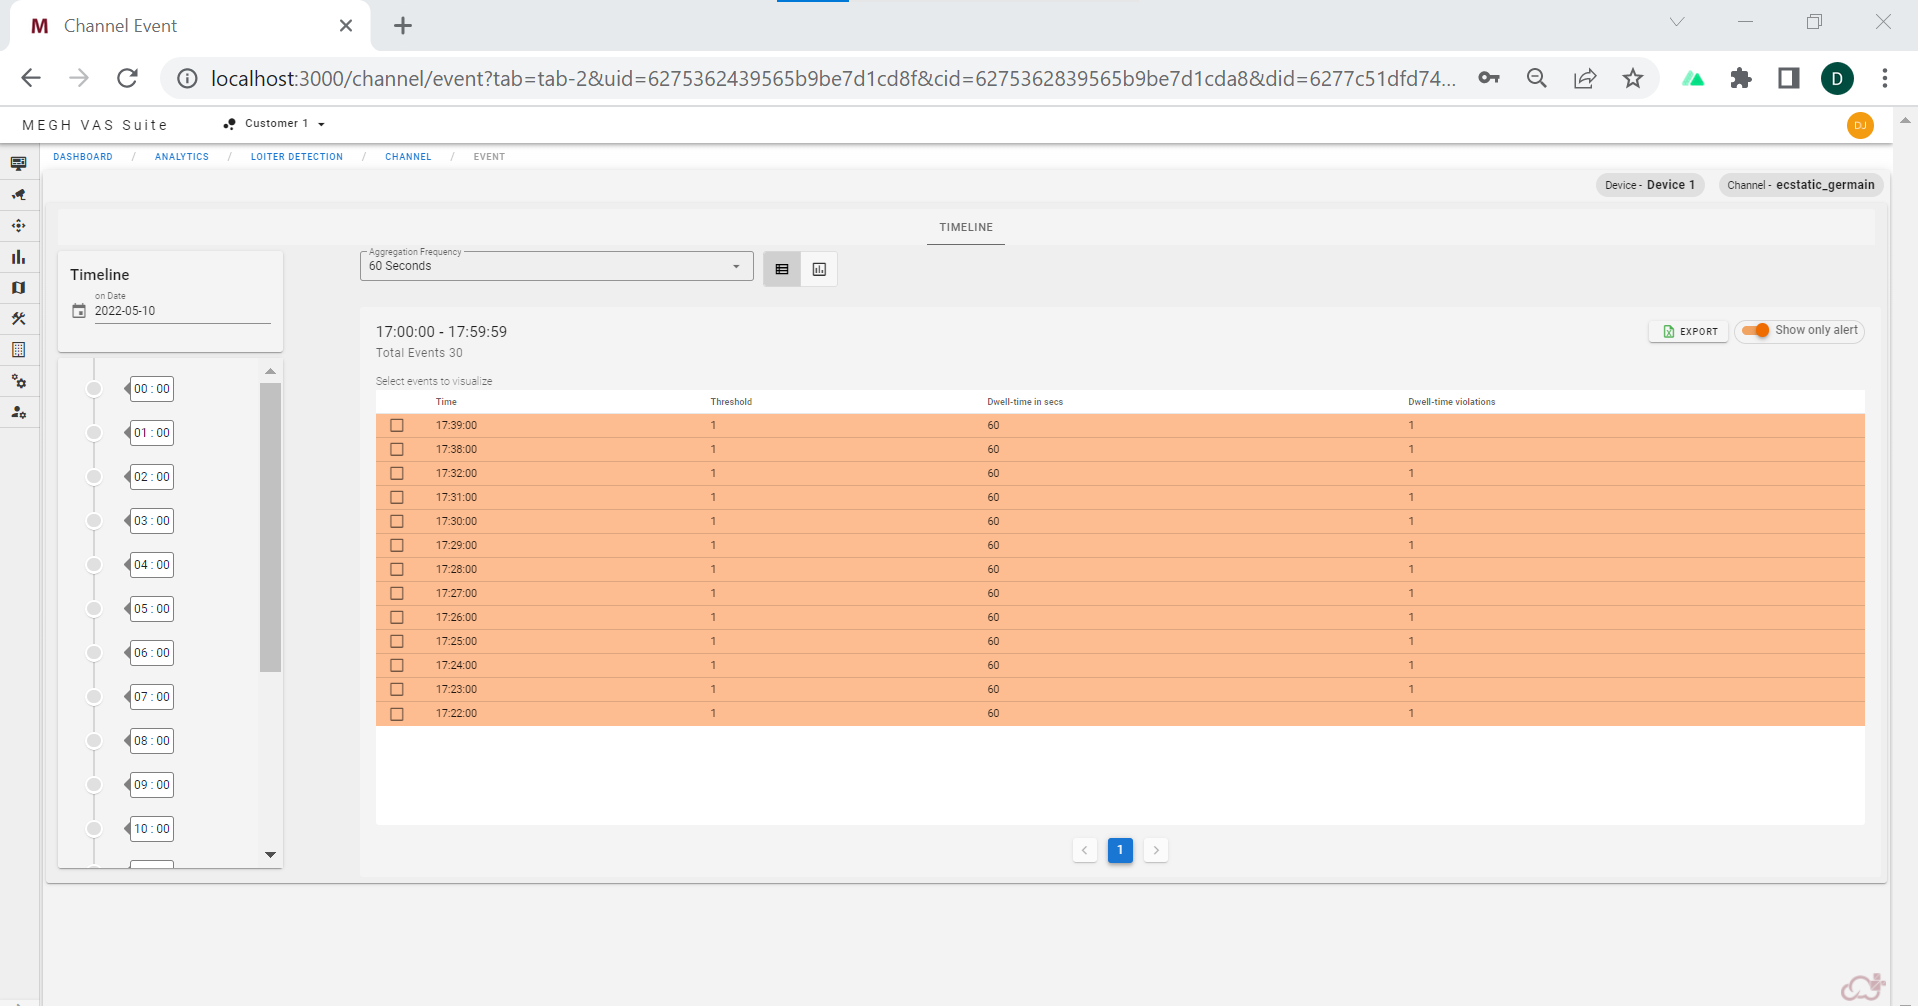
This window has a show only alert slider which when made ON will show only alerts otherwise it shows all the events with and without alerts.
Aggregation Frequency can be set according to the user's choice on the top of the page.
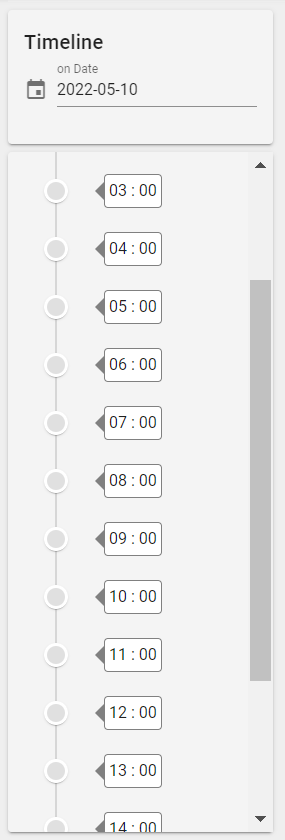
Time can be selected from the Timeline bar, the user must select the particular hour of the day for which events need to be displayed. Similarly date can be selected from the calender by clicking on the date for which user want to display events.
The events will be listed according to aggregation frequency, for example: if the aggregation frequency is set to 20 seconds then the events are listed for every 20 seconds as shown above.
The Events on the page can be viewed in two different formats, this can be done by selecting the icons on right of the aggregation frequency option :
- Table view: In this the Event details are displayed in the tabular format as already shown in the event history page. This is the default view.
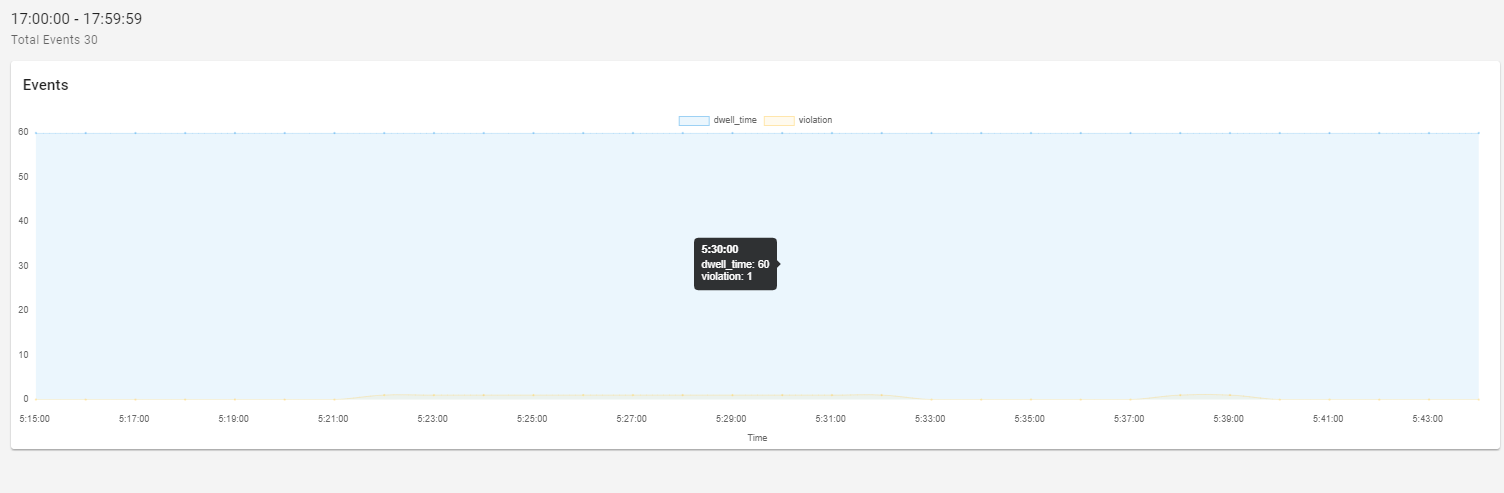
- Chart view: In this the Event details are displayed in the chart or graph view, where the time is displayed in the X-axis and number of detections on Y-axis.The total detections, violations and non violations are represented with different colors on the chart as shown below:
In the Timeline view, events according to selected time and date are listed. The default view is the Timeline view.
The event details can be exported to an excel sheet using export option on top right corner.
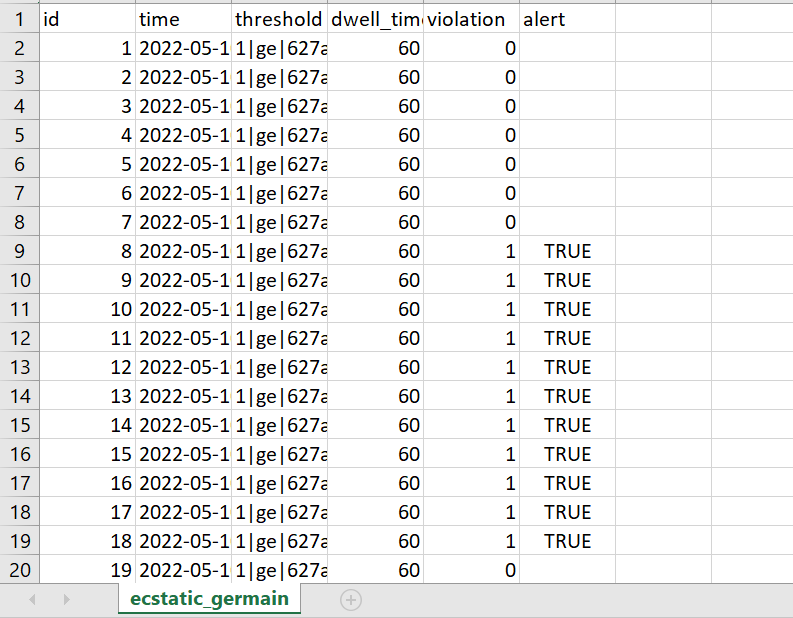
The exported excel sheet will be downloaded to user’s system which contain details of the event like id, time, threshold, alert, non-violation, total, violation and other details as per the usecase as shown in the above figure.
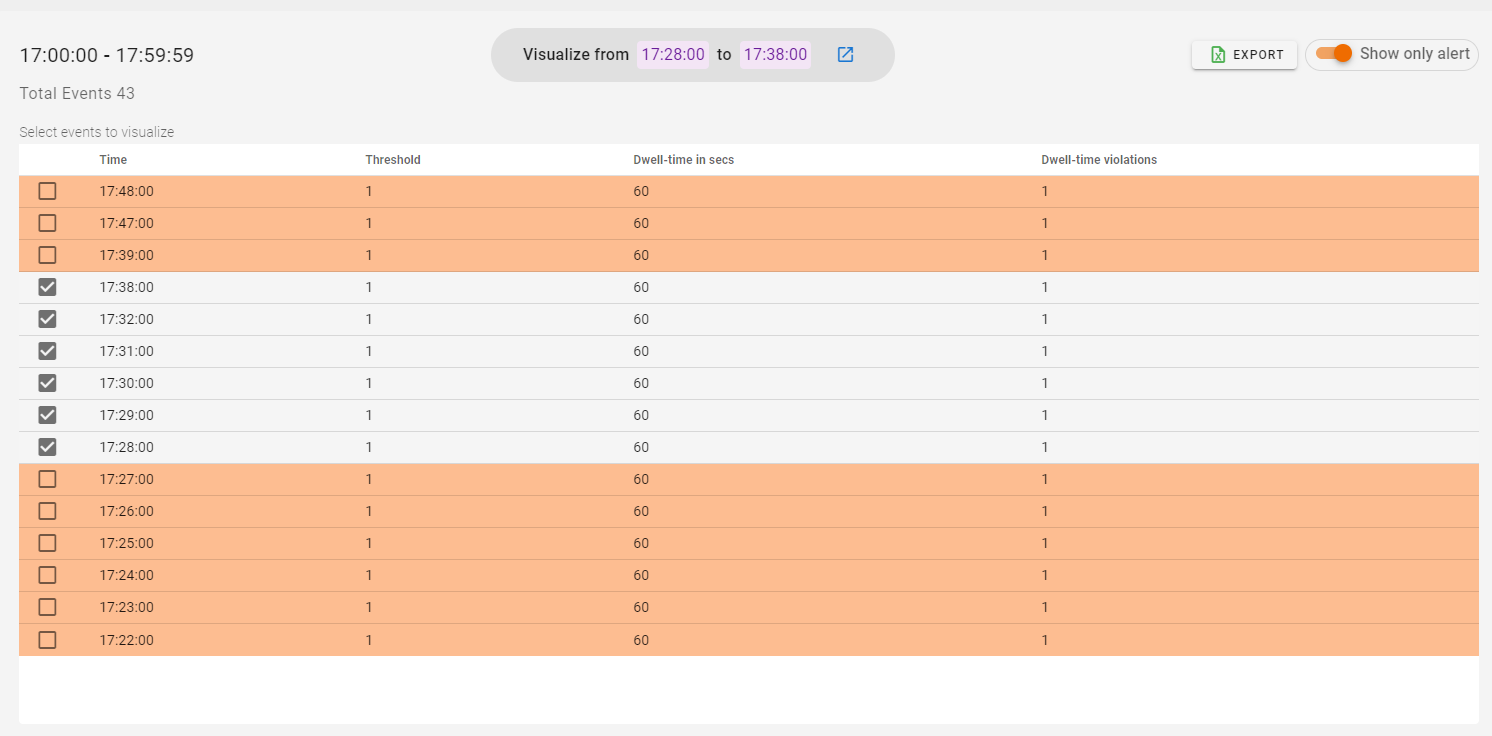
The Events can be visualized by selecting the check boxes given on the left side of each events.
The user must select two checkboxes, one is the start event from which user want to start visualizing till another event where the user want to stop visualizing.
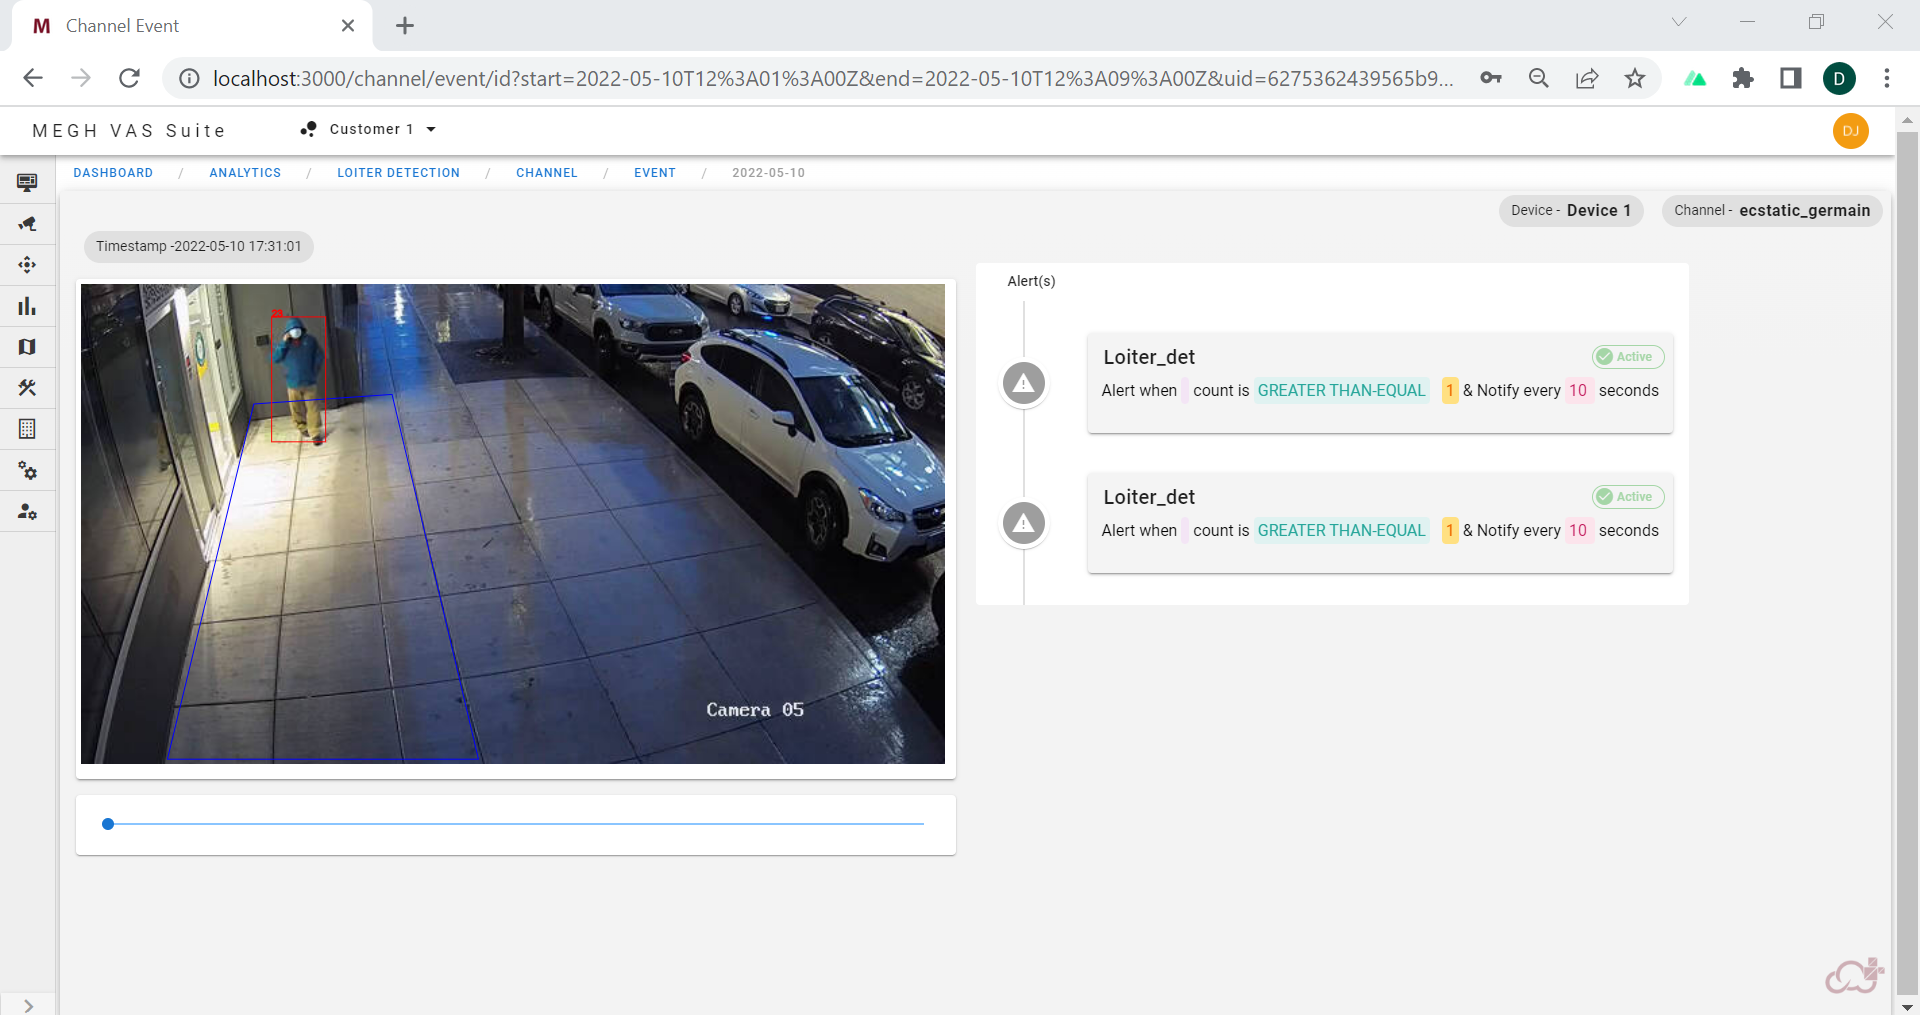
The user can select blue arrow on the visualize tab in the centre to visualize the selected events which takes user to new page.
Here the user can use the blue slider to slide over the frames of the events and focus the details in the frames as per the requirements.
The alerts which caused the following events to occur will also be highlighted on right side of the page as shown below: